
GIS360
Advanced Leak Management
Visualize, manage, and track leak surveys in one platform.
GIS360 is web-based leak survey software for natural gas utilities. It consolidates survey data from SENSIT gas detectors into a single mapped environment and exports to external GIS systems. Teams can manage natural gas network surveys, monitor field activity, analyze recorded information, and maintain visibility throughout the leak management process.
Bring Leak Survey Data Into One Operating Environment
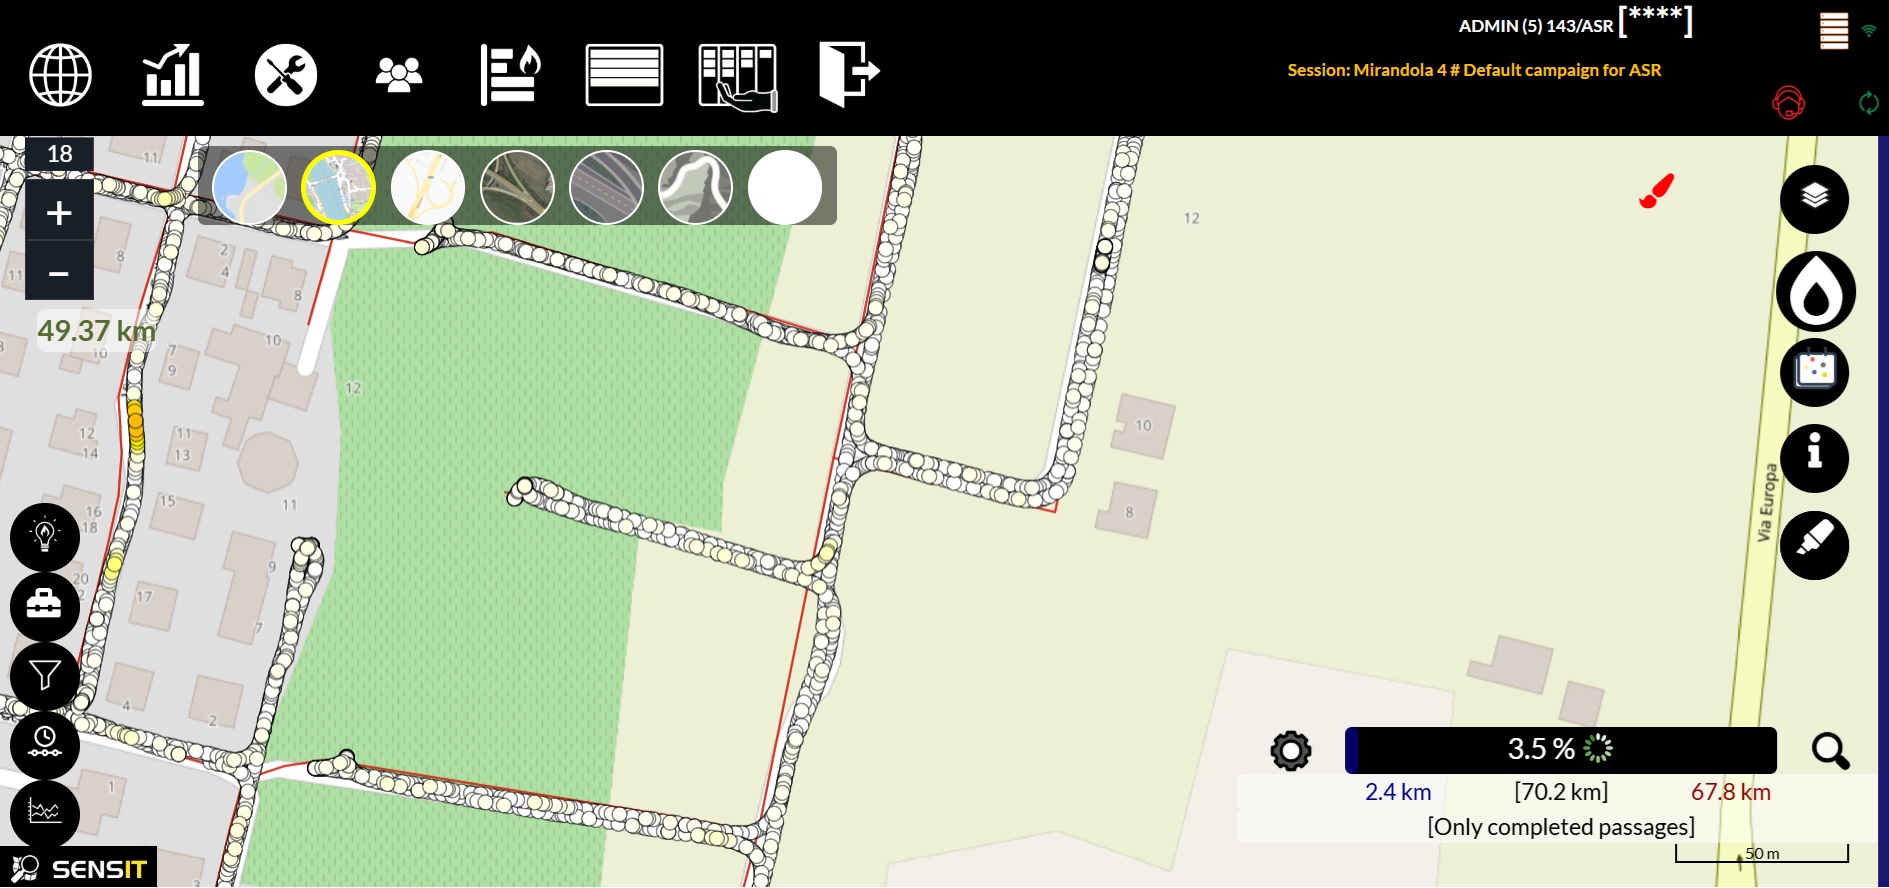
GIS360 is a web-based operating environment designed to support natural gas network surveys. The platform brings system parameters, service functions, geographic information, and recorded events together within one interface.
Using an OpenStreetMap navigation background, GIS360 can overlay gas network mapping to help operators follow pipelines and improve visibility across surveyed areas. Clear graphical attributes identify surveyed network sections and logged system events.
From survey planning to reporting, GIS360 helps teams organize activities and better understand field data.
Advanced Mapping and Visualization
Visualize leak surveys, investigations, system assets, historical information, and completed work across compatible SENSIT detectors
Complete Survey Workflow
Manage every stage of the survey, from defining users and assigning sessions to monitoring fieldwork and creating reports.
Data Synchronization
Exchange assigned sessions, survey priorities, and collected field data between connected devices and the central GIS360 server.
Network Interaction
Overlay gas network mapping, review georeferenced indicators, and associate notes or field photographs with specific network segments.
Advanced Visualization of Leak Surveys and Investigations
GIS360 provides a centralized view of survey information across compatible SENSIT gas detection instruments. Teams can visualize detector data, monitor survey workflows, review historical information, and verify completed work.
The platform can also import system pipes and assets, identify higher-risk areas, and generate custom reports in KMZ, GPX, and PDF formats.
| Continuous field activity tracking | Survey workflow monitoring
| Historical leak information | Imported pipe and asset information
| Completed-work verification | Visualization across compatible detectors
Manage Every Stage of the Survey
The GIS360 workflow moves from defining users and roles through session assignment, surveying, status review, and reporting.
STEP #1
Define
Set up users, responsibilities, roles, and team functions.
STEP #2
Assign
Create survey sessions and assign activities to field operators.
STEP #3
Survey
Collect location, gas concentration, time, and other field information using compatible SENSIT instruments.
STEP #4
Monitor
Check session status, view field activity, and track survey progress.
STEP #5
Report
Analyze collected data and issue reports in supported formats.
Connect Field Devices With Centralized Survey Data
The GIS360 synchronization module is designed to exchange information between field devices and the central server. Field users can receive assigned sessions and their priorities, while acquired information can be returned from users in the field.
| Send assigned sessions to field users
| Communicate survey priorities
| Recieve aquired field data
| Consolidate information from multiple users
| Maintain visibility between field operations and the central platform
Connect Survey Information
to Your GIS System
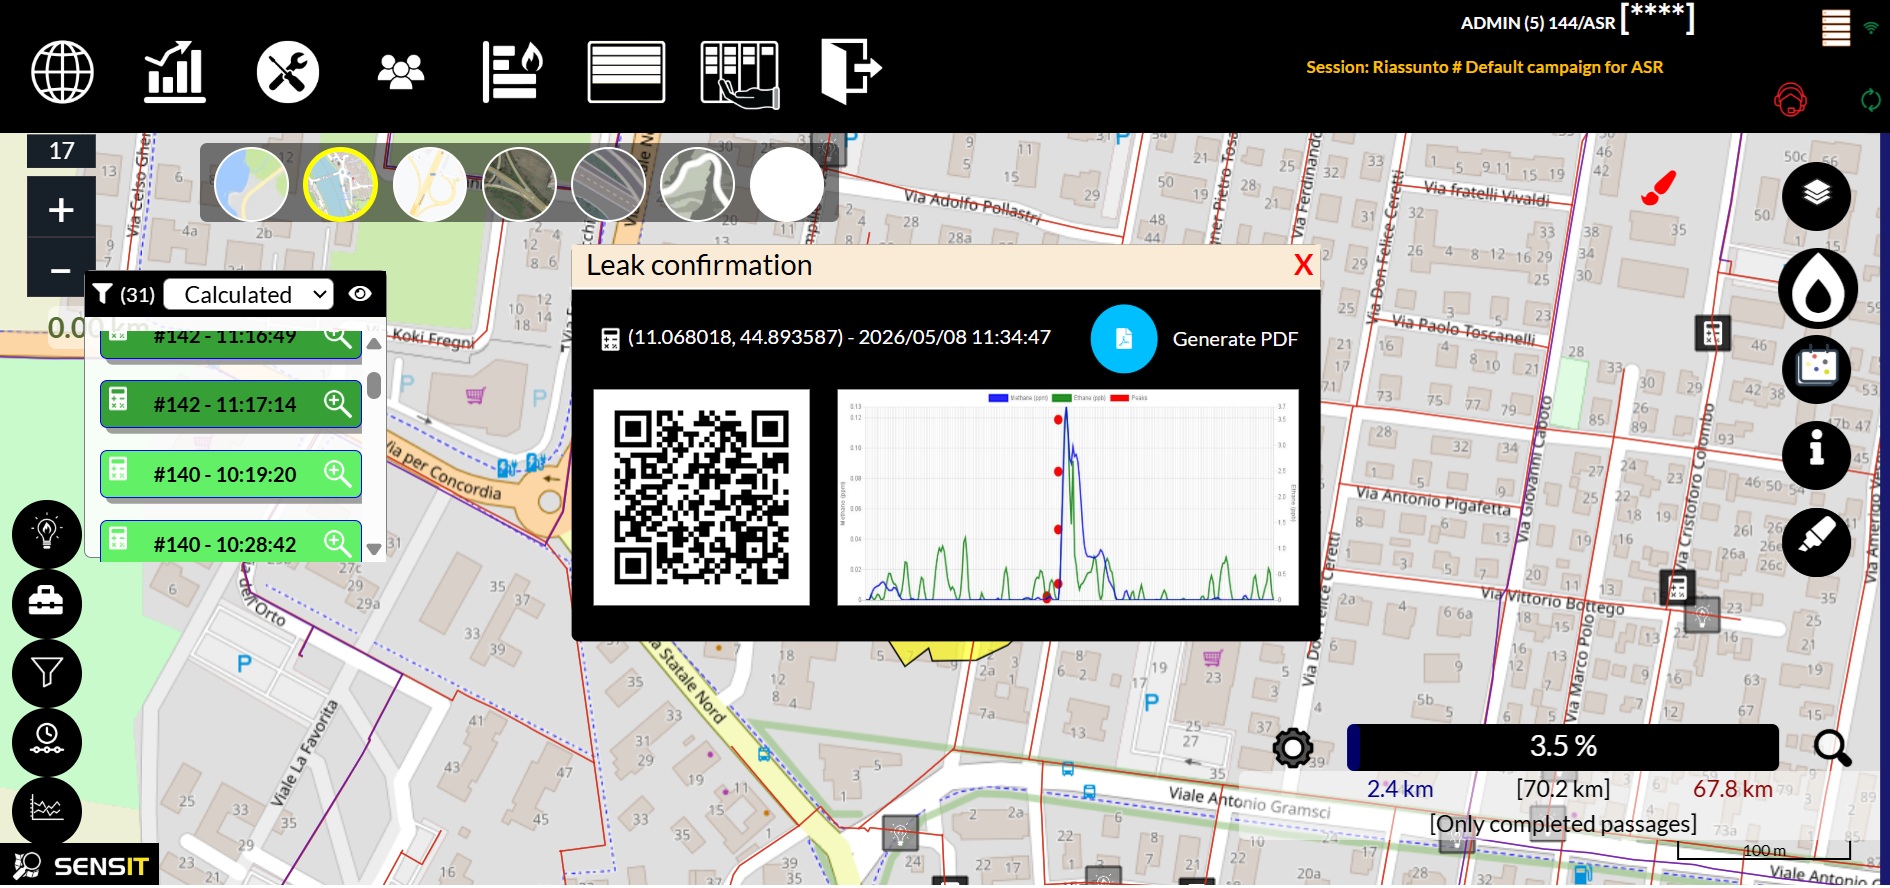
GIS360 allows SHAPE files to be exported and displayed in other GIS systems. Operators can review georeferenced indicators, including concentration peaks, and associate notes or field photographs with specific network segments
| Overlay pipeline segments on the navigation map
| Review georeferenced survey indicators
| Add notes to specific network
| Associate field photographs with recorded locations
| Filter collected data by concentration or other parameters
Turn Survey Data Into Actionable Views
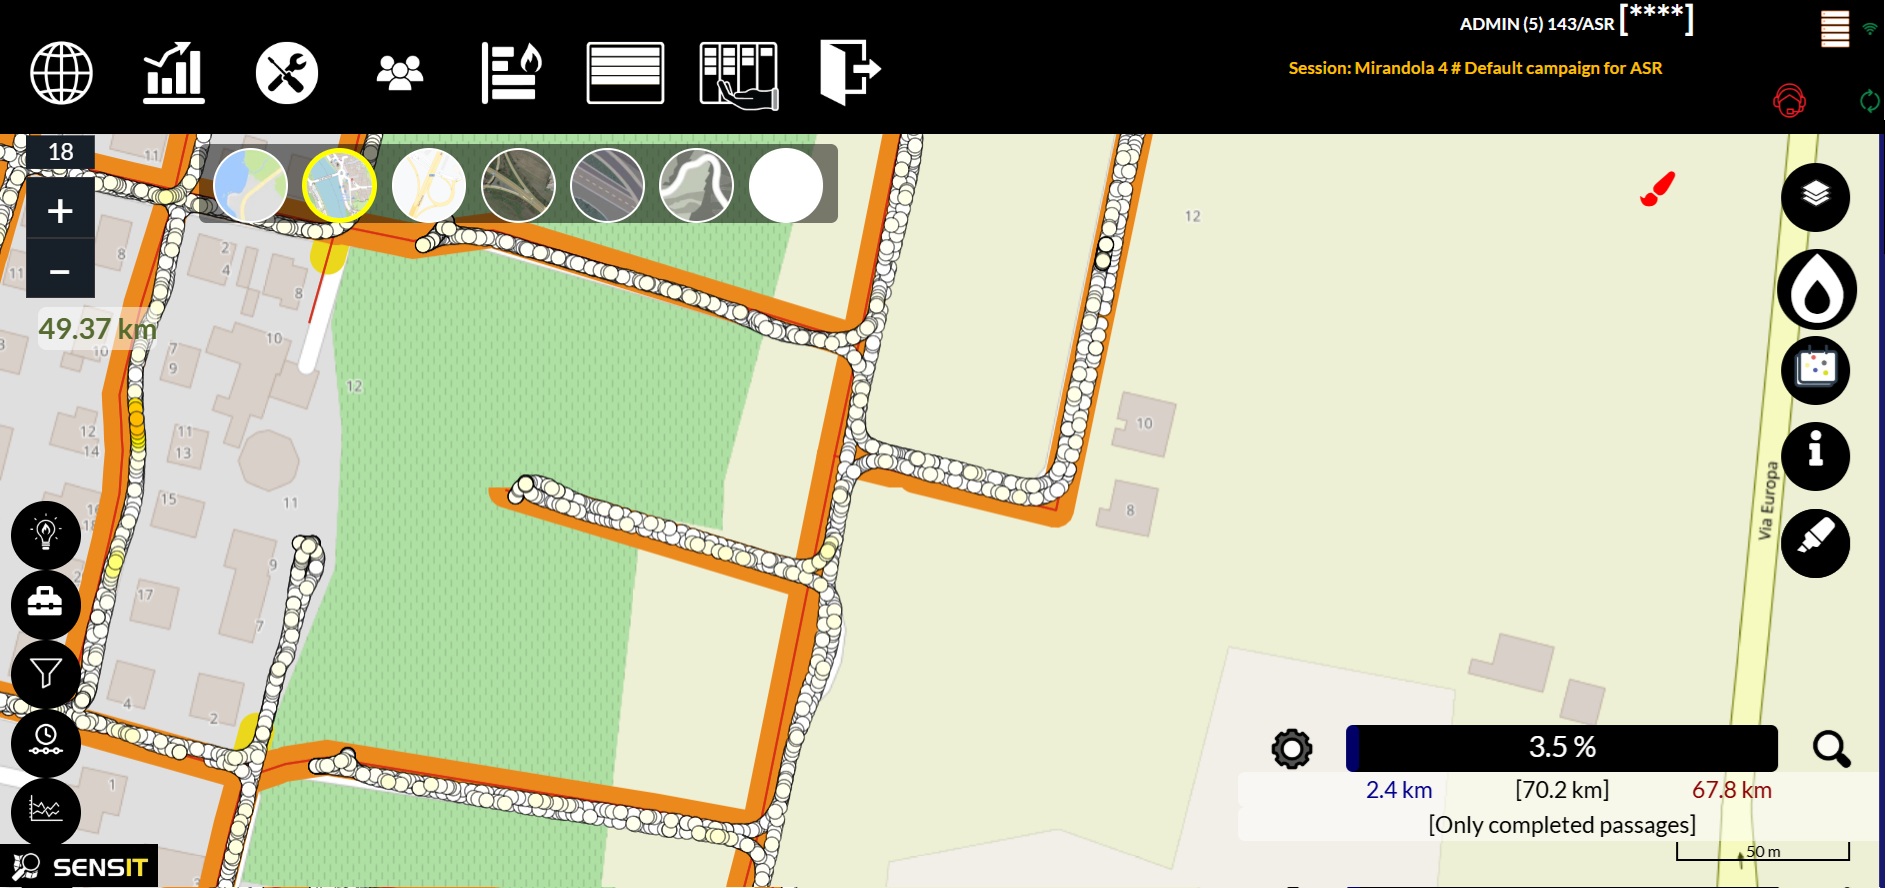
GIS360 can organize information into visual views that support planning and follow-up.
Priority View
Review areas or activities according to established priorities.
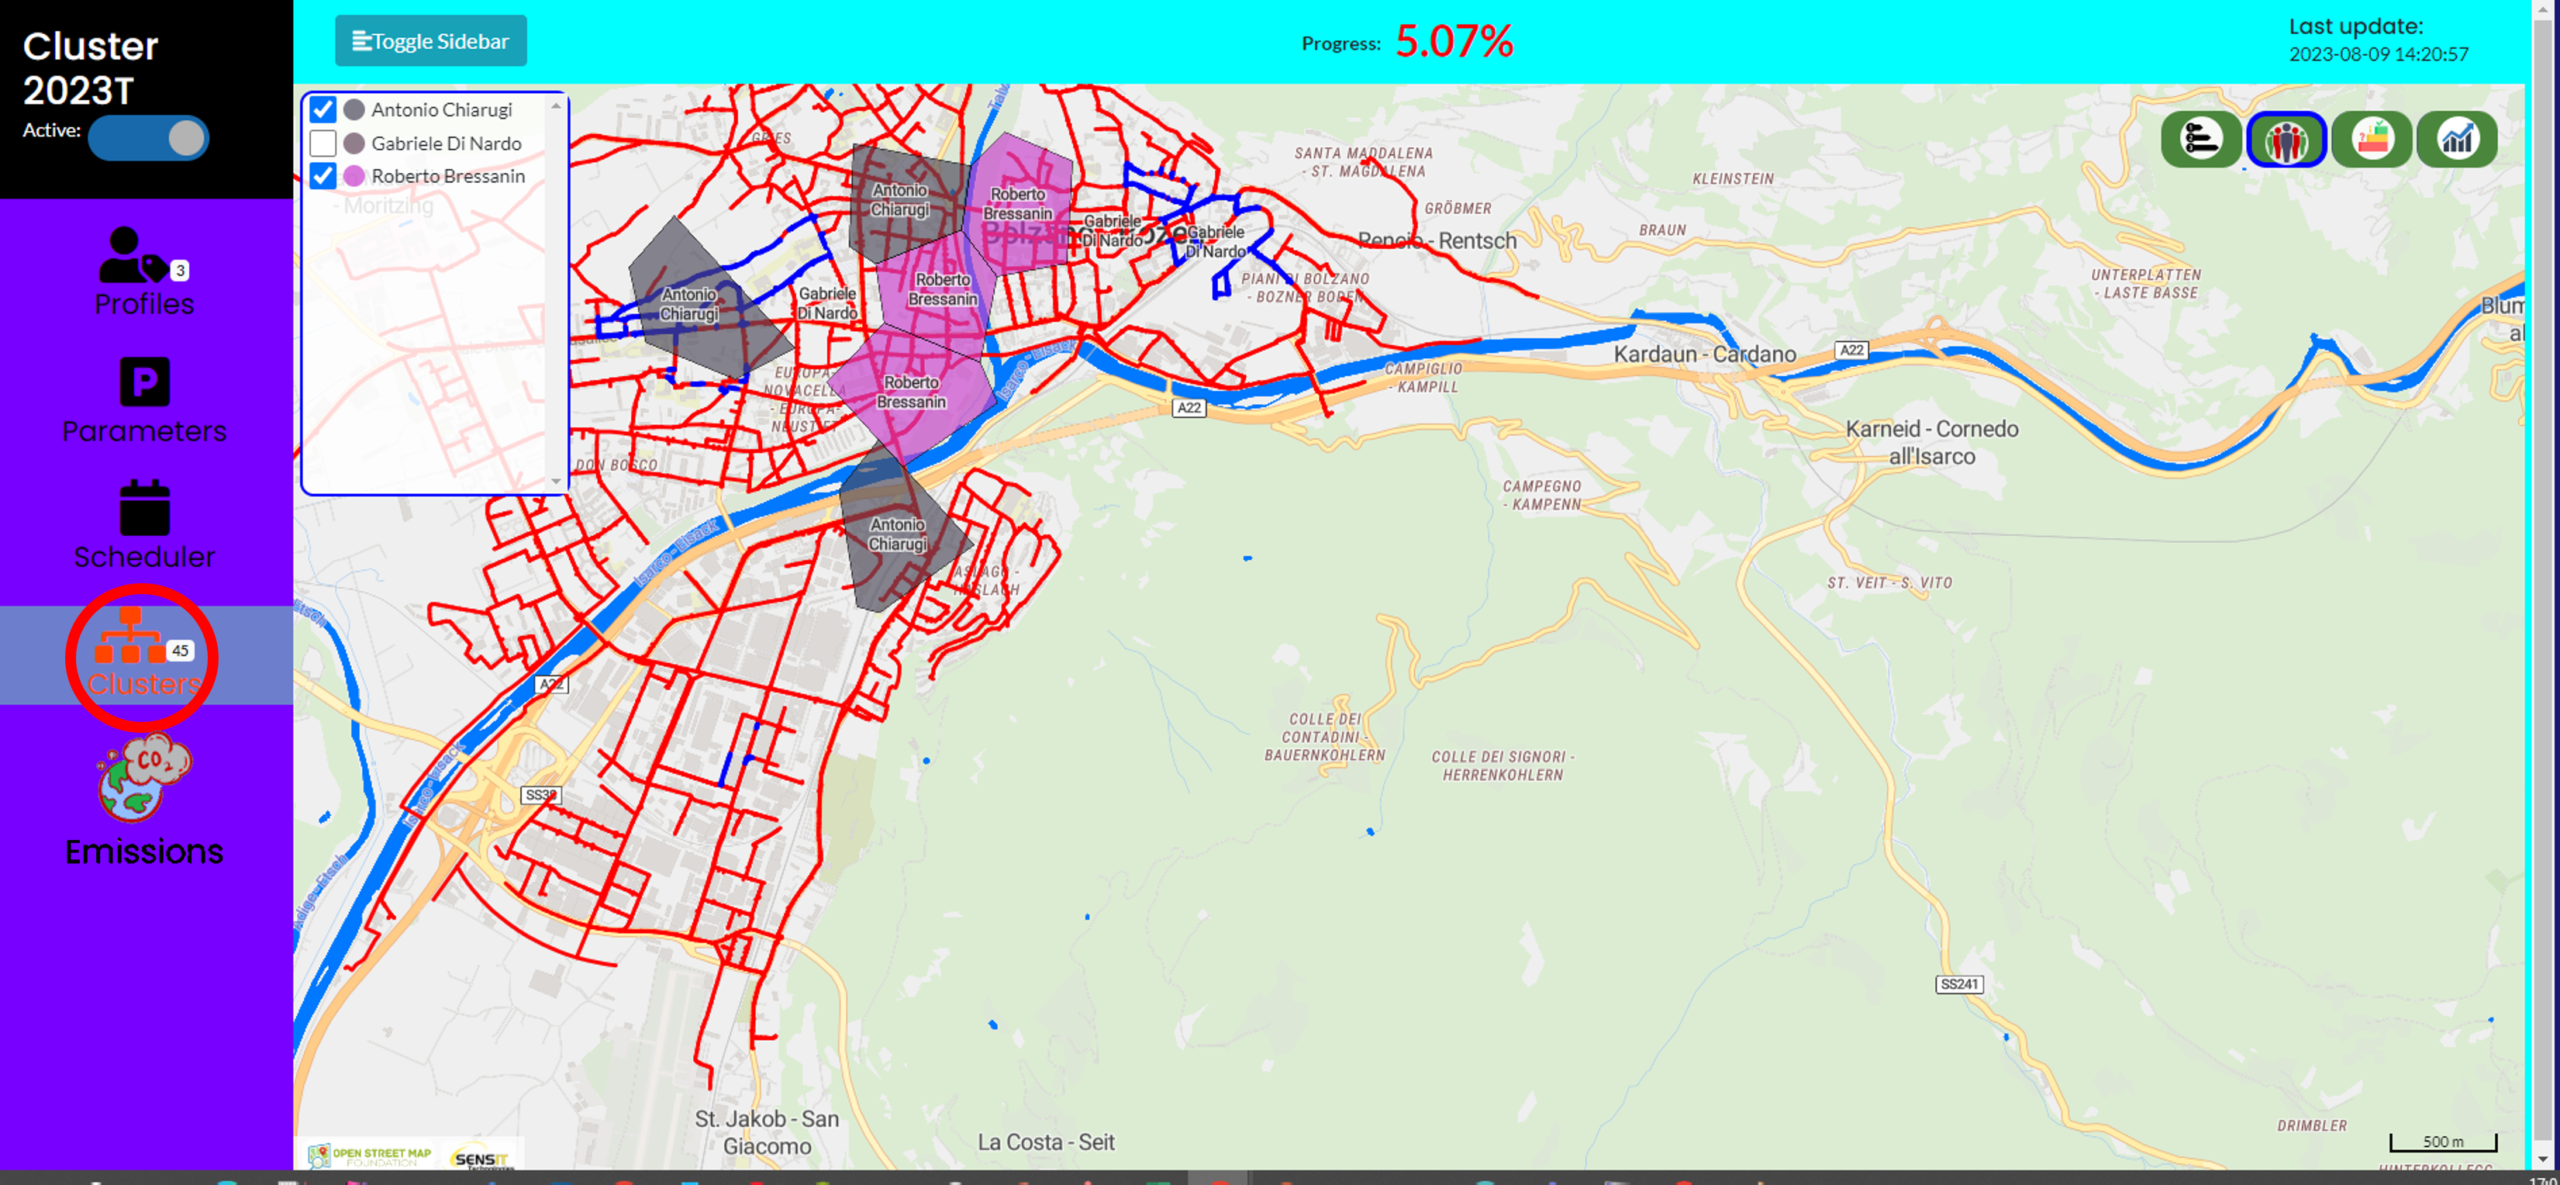
User View
See how survey work is distributed across users or teams.
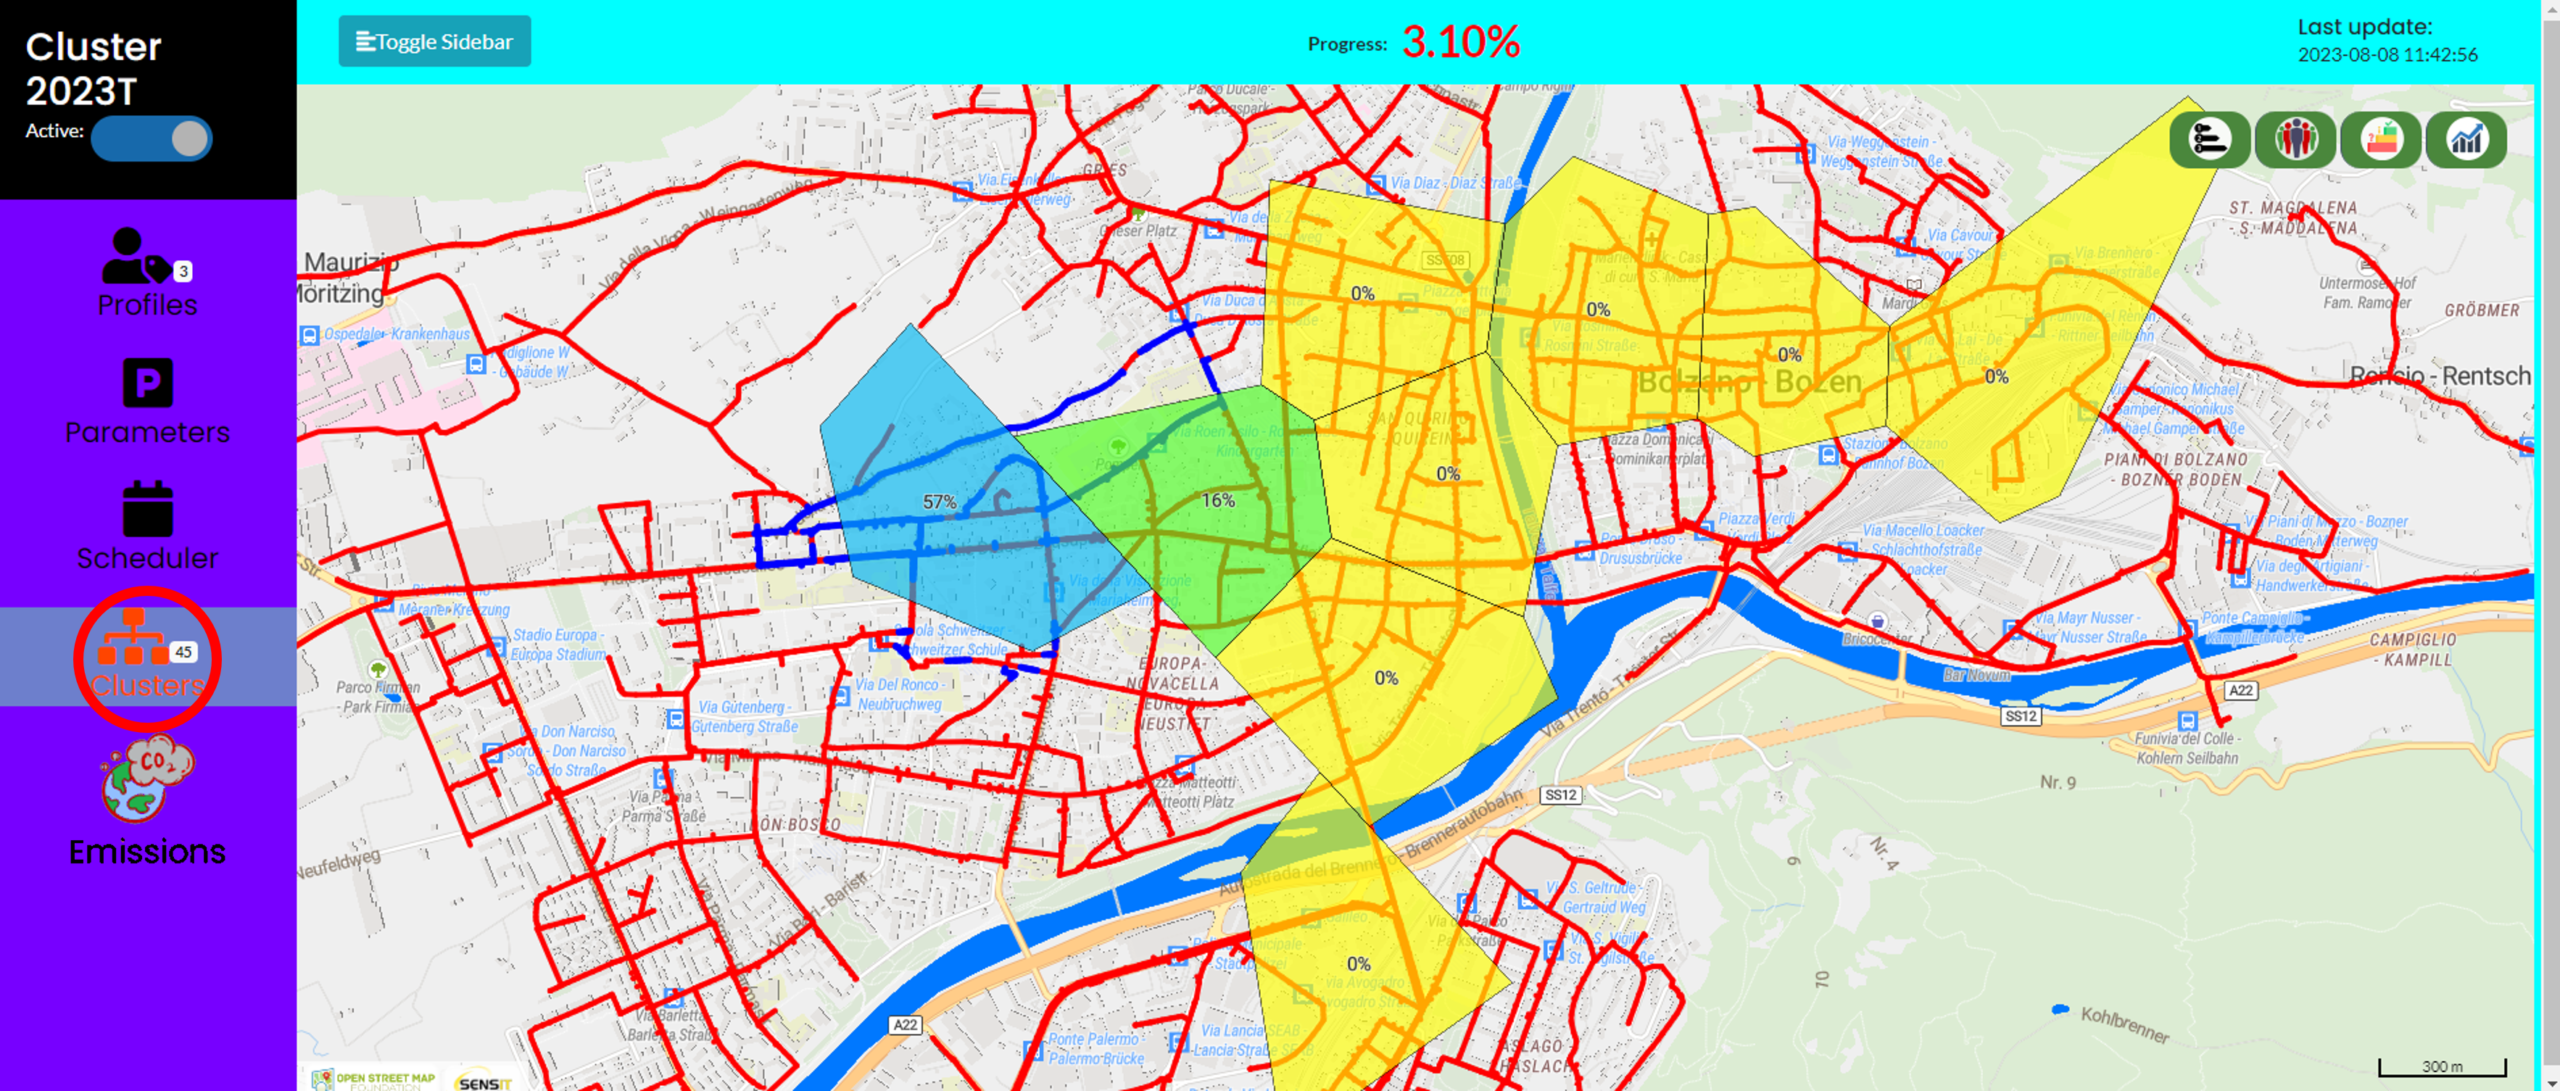
Progress View
Visualize survey advancement across mapped sections of the network.
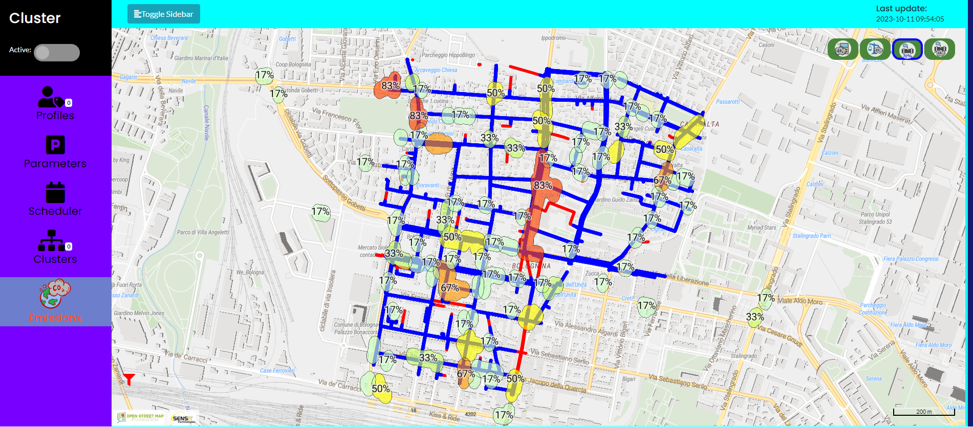
Leak Localization View
Compare information collected in the same area across different sections to evaluate potential leak polygons and estimed likelihood.
One Platform for Compatible SENSIT Systems
GIS360 connects with SENSIT's vehicle-mounted systems and compatible portable detectors.
See How GIS360 Can Support Your Leak Survey Program
GIS360 Mobile
Extend GIS360 Into The Field
GIS360 Mobile is designed for smartphones and tablets that guide field operators during walking surveys of natural gas networks. The mobile interface displays instrument parameters and service functions while preserving a large geographic viewing area.
The application can overlay gas network mapping on its navigation background, show surveyed network sections, and record system events. It also supports photographs, email transmission of data, and report creation.
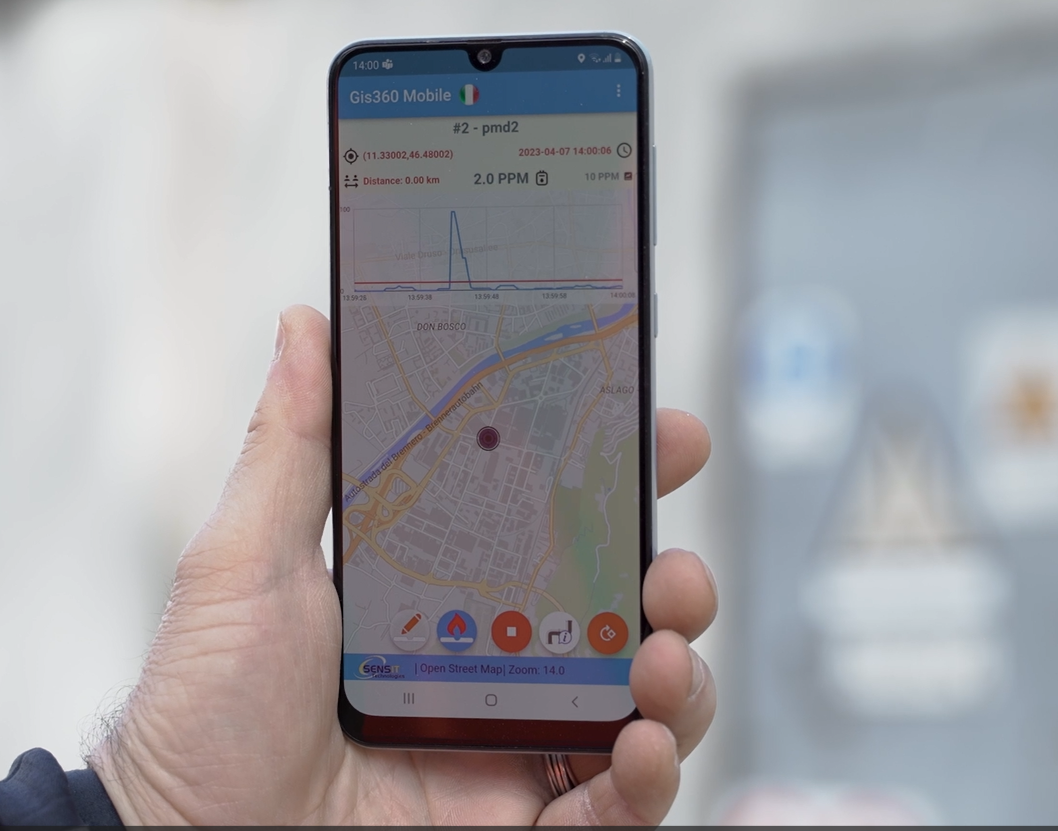
Navigate the Network
View pipeline mapping and geographic survey information from the field.
Record Field Information
Associate notes and photographs with georeferenced network segments.
Continue Previous Work
Return to a previous session and continue from the last recorded location.
Share Survey Results
Transmit collected information by email and issue reports after completing the job.